edr4r is a small, tidy client for OGC API - Environmental Data
Retrieval services with JSON discovery metadata and CoverageJSON,
GeoJSON, or CSV query responses. Most of the real-world use to date has
been against in-situ monitoring networks – stream gauges, weather
stations, snow telemetry, reservoir telemetry – but the package itself
is generic.
Two example endpoints you can point it at right now:
The Met Office Labs EDR demonstrator is another useful endpoint for cross-server experiments. It is a technical demonstrator, not an operational service: its availability, collections, and response details may change without notice, so it should not be used as a production dependency.
This vignette uses the Western Water Datahub’s rise-edr
collection as one real endpoint for demonstrating the core
edr4r workflow. WWDH dataset notes, raw HTTP walkthroughs,
and presentation material live in the standalone WWDH EDR docs. The
USGS example lives in its own article,
vignette("usgs-streamgages").
Installation
Install the current stable release from CRAN:
install.packages("edr4r")The 0.3.0 source release is also available from GitHub
with pak:
pak::pak("ksonda/edr4r@v0.3.0")The v0.2.0-rc.1 and v0.3.0-rc.1 tags were
GitHub-only previews. Use pak::pak("ksonda/edr4r") instead
when you want the mutable development branch.
1. Create a client
library(edr4r)
library(ggplot2)

client <- edr_client("https://api.wwdh.internetofwater.app")
client
#> <edr_client>
#>   base_url:   <https://api.wwdh.internetofwater.app>
#>   user_agent: edr4r/0.3.0 (+https://github.com/ksonda/edr4r)
#>   timeout:    60s
#>   max_tries:  3
#>   retry transport failures: TRUE
#>   discovery cache: 300s
The client just stores connection settings (base URL, user agent,
timeout, retry policy, and an in-memory discovery cache). Pass
verbose = TRUE to echo every request URL,
headers = to attach auth tokens, or
cache_ttl = to change the metadata lifetime.
Try a second EDR implementation
A small terrain lookup is a low-cost way to exercise the non-operational Met Office demonstrator without downloading forecast data:
met_client <- edr_client(
  "https://labs.metoffice.gov.uk/edr",
  timeout = 10,
  max_tries = 1
)

terrain <- edr_position(
  met_client,
  "terrain_tiles",
  coords = c(-0.1276, 51.5072),
  parameter_name = "Height"
)
covjson_to_tibble(terrain)
Because the endpoint is explicitly experimental, this request is not
run when the vignette is built or during R CMD check. The
repository exercises it separately in a scheduled, non-blocking live
smoke check.
2. Discover collections and parameters
edr_collections() lists every EDR collection the service
serves.
collections <- edr_collections(client)
collections[, c("id", "title", "data_queries")]
#> # A tibble: 37 × 3
#>    id                 title                                         data_queries
#>    <chr>              <chr>                                         <list>
#>  1 rise-edr           USBR Reclamation Information Sharing Environ… <chr [4]>
#>  2 snotel-edr         USDA Snowpack Telemetry Network (SNOTEL)      <chr [4]>
#>  3 awdb-forecasts-edr USDA Air and Water Database (AWDB) Forecasts  <chr [4]>
#>  4 snotel-huc06-means USDA Snotel Snow Water Equivalent Aggregated… <NULL>
#>  5 usace-edr          USACE Access2Water API                        <chr [4]>
#>  6 noaa-qpf-day-1     NOAA Weather Prediction Center Quantitative … <NULL>
#>  7 noaa-qpf-day-2     NOAA Weather Prediction Center Quantitative … <NULL>
#>  8 noaa-qpf-day-3     NOAA Weather Prediction Center Quantitative … <NULL>
#>  9 noaa-qpf-day-4-5   NOAA Weather Prediction Center Quantitative … <NULL>
#> 10 noaa-qpf-day-6-7   NOAA Weather Prediction Center Quantitative … <NULL>
#> # ℹ 27 more rows
The data_queries column tells you which EDR query types
each collection supports (locations, cube,
area, …). Hit a verb the server doesn’t implement and you
get an HTTP error.
For a new endpoint, inspect the richer capability metadata or run safe, metadata-only diagnostics before choosing a query:
caps <- edr_capabilities(client, "rise-edr")
caps$queries

edr_supports(client, "rise-edr", query = "cube")
edr_diagnose(client, "rise-edr")
Landing, conformance, collection, instance, and queryables metadata
is cached inside the client for a bounded period. Pass
refresh = TRUE to a discovery call when you need a fresh
server response, or call edr_cache_clear(client).
To see the data parameters a collection exposes (the values you can
pass to parameter_name = on the query verbs), use
edr_parameters():
params <- edr_parameters(client, "rise-edr")
nrow(params)
#> [1] 782
head(params[, c("id", "name", "unit_symbol")])
#> # A tibble: 6 × 3
#>   id    name                                             unit_symbol
#>   <chr> <chr>                                            <chr>
#> 1 1835  Secondary Canal Stage                            ft
#> 2 1834  Lake/Reservoir Elevation                         ft
#> 3 1830  Lake/Reservoir Release - Total                   cfs
#> 4 1818  Total Dissolved Gas (TDG)                        %
#> 5 1817  Growing Degree Days (50 Degree Base Temperature) GDD
#> 6 1816  Calculated Unregulated Flow                      taf
edr_queryables() is something different – it returns the
OGC queryables JSON Schema (filter properties for CQL2 / OGC API
Features). For discovering parameter names,
edr_parameters() is what you want.
# Pick out the daily reservoir storage parameter (id "3"):
params[params$id == "3", c("id", "name", "unit_symbol", "unit_label")]
#> # A tibble: 1 × 4
#>   id    name                              unit_symbol unit_label
#>   <chr> <chr>                             <chr>       <chr>
#> 1 3     Daily Lake/Reservoir Storage (af) acre·ft     Acre Foot
3. Find locations
edr_locations() returns one station-index response as a
GeoJSON FeatureCollection, promoted to an sf
object when sf is installed.
WWDH currently returns its full locations index in that response. On
servers that advertise a rel = "next" link, set
paginate = TRUE together with finite max_pages
and max_features caps.
stations <- edr_locations(client, "rise-edr")
nrow(stations)
#> [1] 926
head(stations[, c("_id", "locationName")])
#> Simple feature collection with 6 features and 2 fields
#> Geometry type: POINT
#> Dimension:     XY
#> Bounding box:  xmin: -122.474 ymin: 32.8834 xmax: -101.2656 ymax: 48.2667
#> Geodetic CRS:  WGS 84
#> # A tibble: 6 × 3
#>   `_id` locationName                                      geometry
#>   <int> <chr>                                          <POINT [°]>
#> 1     1 Marys Lake                            (-105.5343 40.34408)
#> 2     2 Audubon Lake North Dakota              (-101.2656 47.6114)
#> 3     3 Gray Reef Reservoir and Dam            (-106.6989 42.5656)
#> 4     5 Lake Frances Reservoir                    (-112.2 48.2667)
#> 5     6 Spring Creek Reservoir and Debris Dam    (-122.474 40.629)
#> 6     7 Imperial Reservoir at Imperial Dam     (-114.4676 32.8834)
The WWDH rise-edr locations index uses _id
as the identifier column, not id. That’s fine – the query
verbs accept either, and edr_map() will auto-detect.
4. Retrieve data for one station
Pick a known station (Lake Mead, _id 3514) and a
parameter (3, Daily Reservoir Storage) and you get
CoverageJSON back. Flatten it with covjson_to_tibble():
resp <- edr_location(
  client, "rise-edr",
  location_id    = 3514,
  datetime       = "2023-01-01/2023-06-30",
  parameter_name = "3"
)

df <- covjson_to_tibble(resp)
head(df)
#> # A tibble: 6 × 9
#>   coverage_id parameter parameter_label    unit  datetime                x     y
#>   <chr>       <chr>     <chr>              <chr> <dttm>              <dbl> <dbl>
#> 1 1           3         Lake/Reservoir St… af    2023-01-01 07:00:00 -115.  36.0
#> 2 1           3         Lake/Reservoir St… af    2023-01-02 07:00:00 -115.  36.0
#> 3 1           3         Lake/Reservoir St… af    2023-01-03 07:00:00 -115.  36.0
#> 4 1           3         Lake/Reservoir St… af    2023-01-04 07:00:00 -115.  36.0
#> 5 1           3         Lake/Reservoir St… af    2023-01-05 07:00:00 -115.  36.0
#> 6 1           3         Lake/Reservoir St… af    2023-01-06 07:00:00 -115.  36.0
#> # ℹ 2 more variables: z <dbl>, value <dbl>
Retrieve several explicit stations
For an endpoint without a spatial bulk verb, or when you have already
chosen specific stations, edr_location_batch() provides a
finite sequential loop with visible provenance and failures:
selected_ids <- as.character(stations$`_id`[1:5])
batch <- edr_location_batch(
  client, "rise-edr",
  location_id    = selected_ids,
  datetime       = "2023-01-01/2023-06-30",
  parameter_name = "3",
  chunk           = "1 month",
  checkpoint      = "wwdh-monthly-checkpoint",
  resume          = TRUE,
  include_parameters = TRUE,
  max_requests    = 30,
  on_error        = "collect",
  progress        = FALSE
)

batch$requests
batch$data
batch$errors
batch$parameters[
  batch$parameters$id == "3",
  c("id", "name", "description", "unit_symbol", "unit_definition")
]
The request count and every location ID are validated before the
first HTTP call. Here the complete plan is five stations by six monthly
windows. Adjacent closed windows may repeat a boundary observation; the
combined data keeps the earliest exact copy while
batch$requests retains each raw row count. In this example,
the first call initializes the checkpoint and later identical calls
reuse successful or empty windows while retrying unresolved ones. The
checkpoint contains parsed observations and can be removed when the pull
is no longer needed. In this WWDH workflow, cube remains
preferable when all stations in a spatial extent are wanted in one
request.
include_parameters = TRUE makes one explicit, cacheable
metadata request and stores the complete catalog once in
batch$parameters, rather than repeating definitions and
unit identifiers on every observation. The catalog is not stored in the
checkpoint, max_requests counts only data requests, and a
metadata-discovery failure is not collected by
on_error.
5. Plot the time series
edr_plot() is a small ggplot2 wrapper for
the tidy tibble:
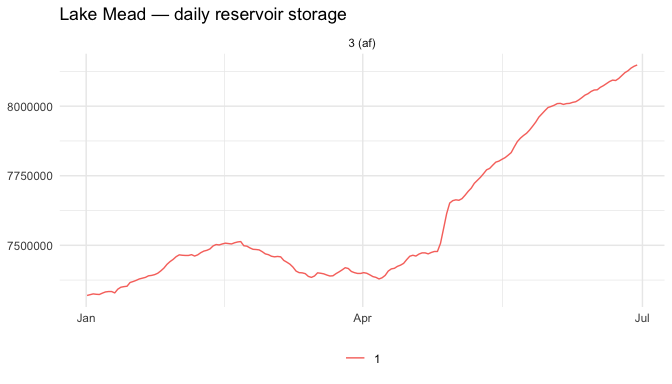
plot of chunk plot-lake-mead
Faceted by parameter (so different units don’t share a y-axis) and coloured by station. Add layers or themes like any other ggplot.
6. Map stations with per-station popups
For collections that support cube,
edr_explore() fetches every station’s data in
one bulk request and renders the map with per-station
popups – much faster than fetching one station at a time.
rise-edr advertises cube, so the default
method = "auto" takes that path.
m <- edr_explore(
  client, "rise-edr",
  bbox           = c(-114, 32, -111, 38),         # SW US
  datetime       = "2023-01-01/2023-06-30",
  parameter_name = "3",
  popup          = "plot+csv",
  label_col      = "locationName",
  quiet          = TRUE
)
The object prints as an interactive leaflet map in an R session; each blue marker opens the larger plot/CSV popup for the station.
Markers with data are blue (clickable popup with plot + CSV); stations the bbox covers that returned no data for the requested parameter/window are dimmed grey. A legend in the bottom-right explains the distinction.
Save the same map to standalone HTML (selfcontained, no sidecar directory):
edr_save_html(m, "reservoir-southwest.html")A few things worth knowing
-
datetimeis forgiving: pass"start/end", an open interval like"2020-01-01/..", or a length-2 character vector. It gets normalised into the ISO-8601 form the server expects. -
parameter_nameis a character vector. It’s sent as one comma-separatedparameter-namequery parameter. - Some monitoring networks use compound station IDs (colon-separated
triplets like
"1185:CO:SNTL"show up in snow and forecast networks). Those work as-is – reserved characters get URL-encoded for you. A literal/in an ID is rejected, because it can’t survive a round trip through HTTP path segments no matter how you encode it. - Not every server implements every EDR verb.
locations,position,cube, andareaare common;radius,trajectory, andcorridorless so. The client supports them all per the spec, but a call against a collection that doesn’t implement a given verb returns an HTTP error.
See also
-
vignette("cross-endpoint-water-context")– combine a Met Office population grid, USGS river discharge, and WWDH reservoir storage in one bounded Lake Mead study area. -
vignette("compatibility")– the supported EDR/encoding subset, verified endpoint matrix, and known limitations. -
vignette("usgs-streamgages")– a walk-through against the USGS waterdata endpoint, which only advertiseslocations(so the per-station fallback kicks in). - Standalone WWDH EDR docs – WWDH-specific dataset notes, raw HTTP examples, and presentation material.